
What is predictive analytics
In simple words, it answers the question “what will happen if nothing changes, and how much time do we have”. A regular report shows what has already happened, and a forecast shows what can still be prevented.
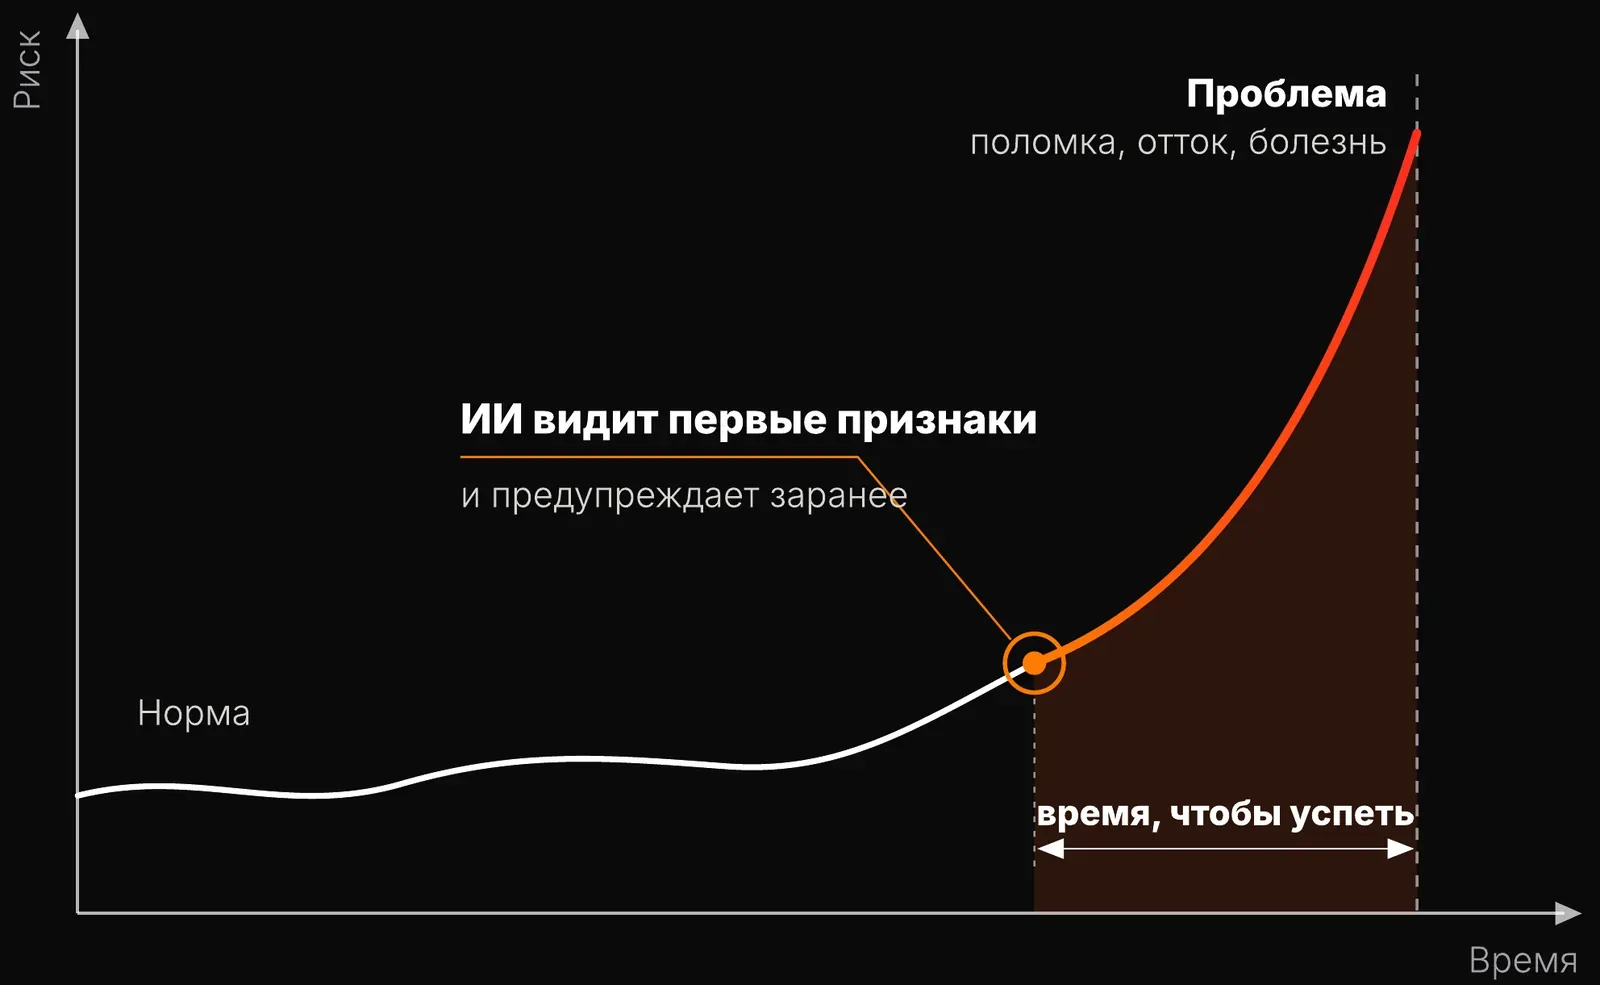
The logic is the same in any industry. While a process is normal, its indicators move within usual limits. Before a problem they start to change: bearing vibration grows, a customer opens the app less often, a patient’s test results shift.
People notice such shifts late, because they are weak and there are many of them. A model watches all the indicators at once and gives a signal at the first signs. Between the signal and the problem there is time to act: order a part, call the customer, invite the patient to a doctor.
The most common case is predictive maintenance of equipment: repairs based on a forecast of its condition, not on a schedule and not after a failure.
Predictive maintenance of equipment: the ChMK case
At Severstal’s Cherepovets steel plant, a model watches the vibration of the hot-rolled coil conveyors. When the signal moves away from normal, it looks for the source of the deviation and calculates how much time is left before the parameters go beyond safe limits.
Staff get a warning in advance. A repair stop can be planned for a convenient time instead of waiting for a failure in the middle of a shift.
The result, according to the MIPT almanac: 7 hours less downtime, worth $780,000. This is a market case, not our project.
The diagram below shows how this looks over time: the risk curve, the point of the first signal and the window in which you can still act.
$780,000
from 7 hours less downtime
- 01Finds deviations in how equipment runs
- 02Locates the source of the anomaly
- 03Predicts when readings will leave safe limits
- 04Warns the staff in advance
Almanac “AI in Industry”, AI Institute of MIPT (Moscow Institute of Physics and Technology), 2026
One logic in four sectors
The same principle works far beyond factories. Only the indicators in which the model looks for the first signs change.
In oil and gas it is a pressure jump in a pipeline before a leak and deviations on pumps. We found no verified figure with a source for leaks, and the closest example with an estimate is flare monitoring in oil and gas, which the MIPT almanac puts at $1.8 million a year.
In industry it is conveyor vibration before a breakdown, as at ChMK. In retail it is growing demand before an empty shelf: in the 2020 pilot of the Perekrestok chain (X5), demand forecast accuracy was more than 70%.
In the public sector and healthcare it is the risk of disease before an attack. From October 2025 to March 2026, the AI of EMIAS, Moscow’s health information system, found 48,500 residents with a high risk of coronary heart disease, and the diagnosis was confirmed in 11,000 of them.
How the same models plan purchases and the load on workshops is covered on the page on demand forecasting.
One logic in four sectors
Resources
A flare leak before an accident
$1.8 million a year
MIPT almanac
Industry
Conveyor vibration before a breakdown
$780,000 for 7 hours
Severstal
Trade
Rising demand before the shelf is empty
over 70% accuracy
X5
Public sector
Disease risk before an attack
11,000 confirmed diagnoses
EMIAS, Moscow
Almanac “AI in industry”, MIPT Institute for AI, 2026 · Retail.ru, 08.06.2020 · Kommersant, 2026
What it gives: downtime and repairs
Exactly as much as the prevented hours of downtime and emergency repairs cost on your equipment. There is no common figure for everyone, and we will not use someone else’s.
Of the verified figures there is the ChMK case: the 7 hours of downtime the model helped avoid were worth $780,000. Across 12 cases in the MIPT almanac with a comparable yearly estimate, the median effect of one solution is $1.7 million. Other examples are on the page about AI in industry.
Your calculation is built from four numbers.
1. The cost of an hour of line downtime, including lost output.
2. How many hours of emergency stops there were last year.
3. What share of them could have been predicted from sensor readings.
4. How much an emergency repair costs compared with a planned one.
A repair by forecast is cheaper than an emergency one for clear reasons: the part is ordered in advance, the crew comes during a regular shift, and nearby equipment is not damaged. How we calculate this effect is described on the page on calculating the effect.
What data you need
To forecast breakdowns you need three kinds of records: sensor readings, failure history and the repair log. Sensors show the condition, and the history teaches the model which signals came before a breakdown.
The weak spot is most often the history. If failures are recorded as “broke, fixed” without a date, a unit and a cause, the model has nothing to learn from.
Retail needs sales, stock and customer behavior; healthcare needs medical records and images. What to measure in each industry and where to send it is covered on the page on data for AI.
Where to start
Start with one type of equipment or one process where a failure costs the most. Count how much you lost on it last year.
Then check whether it has sensors and whether the failure history is recorded. If so, you can build a model. If not, the first step is collecting readings, and its cost goes into the calculation.
Such a solution goes into the AI solutions map as a line with its effect, cost and payback period. In a free 30-minute review we will name the processes where a forecast will pay off and the data that is missing.